In the modern landscape of crime investigation, Link Analysis serves as a crucial technique for uncovering hidden connections, detecting patterns, and visualizing complex networks. By transforming raw, fragmented data into structured insights, investigators gain clarity on criminal organizations, financial frauds, and cybercrime operations.
This post give you an overview into the principles of Link Analysis, offering some real-world examples that demonstrate its power and application.
Key Principles of Link Analysis
- Entity Identification: Recognizing the key people, organizations, assets, and locations involved in an investigation.
- Relationship Mapping: Building connections between entities using communication records, transactions, or common activities.
- Pattern Analysis: Detecting anomalies, repetitive sequences, or irregular behaviors in data.
- Temporal Analysis: Understanding how relationships evolve over time and identifying key events or triggers.
- Centrality Detection: Identifying the most influential or pivotal nodes in a network.
- Data Fusion: Integrating diverse data sources (emails, phone records, financial logs) into a unified analysis model.
- Visualization: Presenting findings in interactive, easy-to-understand network graphs.
Each principle plays a role in turning raw data into actionable intelligence.
Graph Theories in Link Analysis: Understanding Complex Networks
Homophily in Link Analysis: Homophily refers to the principle that similar nodes in a network are more likely to form connections with one another. In the context of criminal investigations, this principle is crucial for identifying clusters of individuals or entities that share common characteristics, such as geographic location, financial patterns, or communication methods. For example, in a terrorist financing network, individuals who share the same ideology or purpose are more likely to transact money through similar channels. By leveraging homophily, investigators can identify clusters of individuals exhibiting similar behavior and uncover hidden connections within those groups. A practical case might involve detecting a group of seemingly unrelated bank accounts repeatedly making donations to a specific charity, which on closer analysis reveals ties to extremist funding.
Centrality Measures for Identifying Key Players: Centrality measures, such as Degree Centrality, Betweenness Centrality, and Eigenvector Centrality, are graph theory metrics used to determine the importance of a node within a network. Degree Centrality identifies nodes with the most direct connections, while Betweenness Centrality highlights nodes acting as bridges between clusters. For example, in a drug trafficking investigation, Betweenness Centrality might reveal a seemingly low-profile individual who acts as a courier, connecting multiple suppliers and distributors. This individual might not have many direct connections but plays a critical role in ensuring communication and logistics across the network. Eigenvector Centrality, on the other hand, helps identify influential figures who are well-connected to other influential nodes, such as a cartel leader coordinating operations indirectly through intermediaries.
Community Detection Algorithms for Cluster Analysis: Community detection algorithms, such as Louvain Modularity or Girvan-Newman, are used to identify tightly knit groups or clusters within a network. These clusters often represent groups sharing common objectives or activities. In a cybercrime syndicate, community detection might uncover distinct groups—one managing phishing campaigns, another handling malware distribution, and a third laundering the proceeds. By isolating these clusters, investigators can prioritize their focus, targeting high-impact nodes within each group. For instance, identifying a small yet highly active sub-group coordinating ransomware attacks across multiple countries could provide actionable intelligence to disrupt their operations effectively.
In each case, graph theory principles provide investigators with a structured, data-driven approach to uncovering hidden patterns, prioritizing leads, and visualizing complex relationships across networks.

Examples of Link Analysis in Criminal Investigations
Over the years, I’ve had the privilege of working on numerous complex investigations using Caseboard, a powerful platform designed for analyzing and visualizing intricate networks. From uncovering transnational drug trafficking rings to identifying hidden patterns in financial fraud and disrupting cybercrime syndicates, Caseboard has been an indispensable tool in transforming fragmented data into actionable intelligence. My experience spans diverse cases where Link Analysis, supported by robust graph theories and visualization techniques, played a critical role in revealing hidden connections, central figures, and operational patterns. In the following examples, I’ll share insights into how these techniques were applied in real-world scenarios, highlighting both the challenges faced and the outcomes achieved through meticulous analysis and strategic application of Link Analysis principles.
1. Breaking Down a Multi-Layered Drug Trafficking Syndicate
Scenario: A transnational drug cartel uses multiple intermediaries and offshore accounts to distribute illegal substances across borders.
Link Analysis Application:
- Data sources include communication logs, financial transactions, and border crossing records.
- Mapping individuals connected to each intercepted shipment.
- Identifying central nodes — individuals coordinating shipments, financial transfers, and ground-level distribution.
- Tracing connections between front companies used for money laundering.
Outcome: Investigators discovered a financial controller based in a neutral country who was funneling drug profits through a network of charities and fake businesses.
Key Insight: The central node wasn’t a visible cartel leader but a financial strategist operating behind multiple layers of anonymity.
2. Identifying Insider Threats in Corporate Fraud
Scenario: A multinational corporation notices irregularities in procurement contracts and expense claims.
Link Analysis Application:
- Data sources include procurement logs, financial transactions, internal emails, and external vendor communications.
- Identifying repeat connections between an internal procurement officer and a vendor receiving excessive contracts.
- Cross-referencing with travel records and shared IP addresses.
- Detecting cyclical transactions and unusual patterns in payment schedules.
Outcome: Investigators uncovered a kickback scheme where the procurement officer awarded inflated contracts in exchange for offshore payments.
Key Insight: Link Analysis revealed a pattern of repeated interactions outside standard operational timelines, raising red flags.
3. Disrupting Terrorist Financing Networks
Scenario: Intelligence agencies suspect that a small NGO is being used to funnel funds to extremist groups.
Link Analysis Application:
- Data sources include bank transaction logs, donor lists, travel records, and NGO public disclosures.
- Mapping donors with repeated high-value donations to the NGO.
- Cross-referencing donor information with known watchlists and suspicious travel patterns.
- Analyzing the timing and geographical correlation of financial transfers with known extremist activities.
Outcome: Authorities discovered that a seemingly charitable entity was transferring funds to multiple intermediary accounts before reaching extremist cells.
Key Insight: Link Analysis visualizations revealed how a legitimate front organization was masking illicit financial activities across several countries.
4. Cracking Human Trafficking Networks Across Borders
Scenario: Authorities suspect an increase in human trafficking across a specific border region.
Link Analysis Application:
- Data sources include phone records, border crossing logs, social media activity, and hotel bookings.
- Mapping recurring phone numbers in victim testimonies.
- Identifying patterns of frequent border crossings and correlating them with suspect phone activity.
- Creating time-series maps showing movement patterns across different locations.
Outcome: Investigators identified a coordinated trafficking route, including safe houses, recruiters, and corrupt officials aiding the operations.
Key Insight: Temporal Link Analysis exposed synchronized activities across multiple regions, pinpointing key operational nodes.
5. Unraveling a Complex Cybercrime Syndicate
Scenario: Multiple organizations are targeted by ransomware attacks originating from unidentified global locations.
Link Analysis Application:
- Data sources include IP logs, payment details (cryptocurrency), attack patterns, and phishing email origins.
- Mapping multiple ransomware attacks to common infrastructure points like servers and VPN providers.
- Tracing cryptocurrency wallet transactions through blockchain analysis.
- Identifying overlapping attack vectors across unrelated victims.
Outcome: Investigators linked seemingly independent attacks back to a single cybercrime syndicate, coordinating operations via encrypted channels.
Key Insight: By analyzing cross-network connections, Link Analysis exposed a hidden infrastructure facilitating global cybercrime.
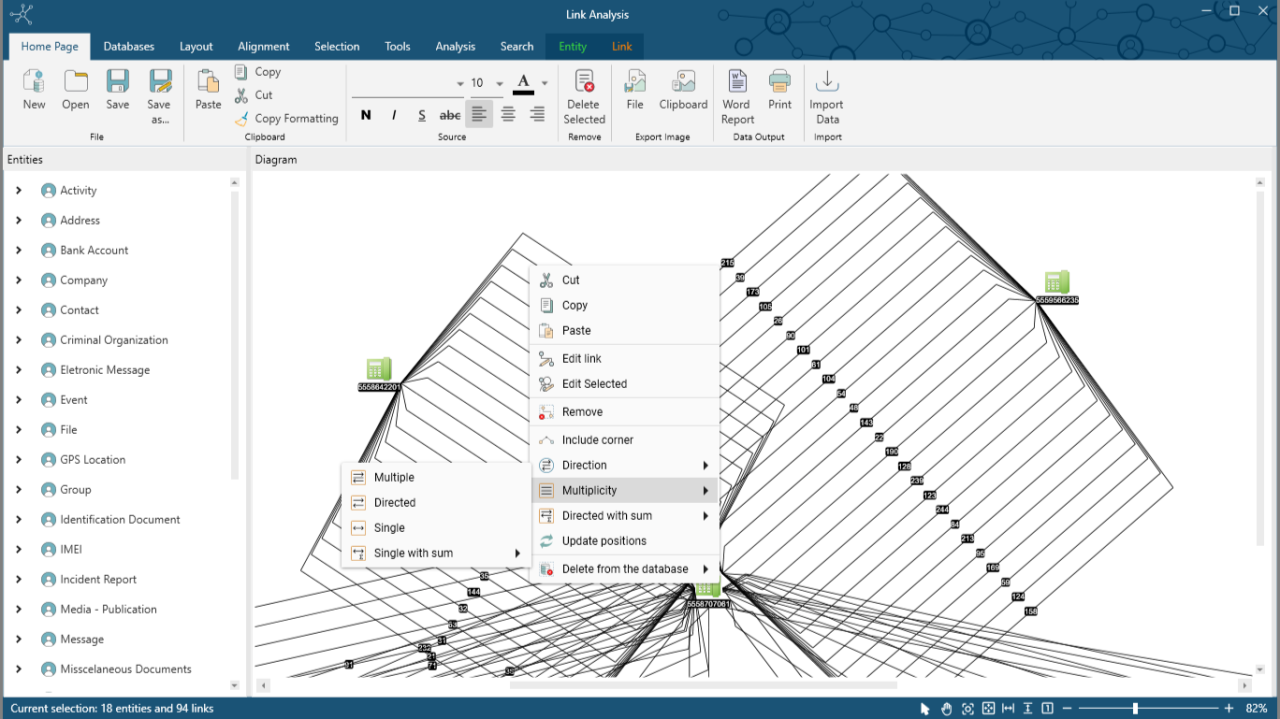
The Power of Tools like Caseboard
Advanced tools like Caseboard make Link Analysis faster, smarter, and more accessible. With its ability to handle vast datasets, Caseboard helps analysts:
- Visualize intricate criminal networks.
- Detect central nodes and high-risk connections.
- Integrate multiple data sources seamlessly.
- Build evidence-based narratives with interactive graphs.
Why Link Analysis is a Game-Changer
- Pattern Detection: Recognizing anomalies hidden in big data.
- Unveiling Hidden Actors: Spotting less visible but critical players in networks.
- Evidence Visualization: Creating clear, court-admissible visual evidence.
- Time-Saving: Reducing manual analysis through automation and algorithms.
Whether it’s drug syndicates, corporate fraud, terrorism, human trafficking, or cybercrime, Link Analysis transforms fragmented data into actionable intelligence.